How this former UNSW lecturer created the world’s go-to COVID-19 tracker

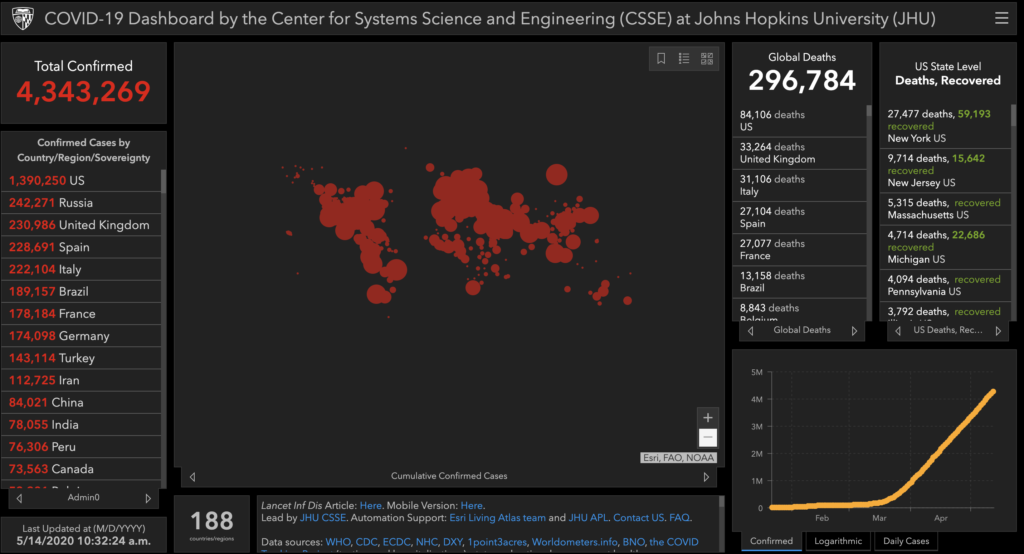
In the months since the World Health Organisation (WHO) declared COVID-19 a pandemic, millions of people around the world have turned to an interactive, web-based dashboard for access to the latest statistics in close to real time.

Built by researchers at the Center for Systems Science and Engineering at Johns Hopkins University (JHU) in Baltimore, the COVID-19 Dashboard displays information about deaths and confirmed cases of the coronavirus around the world.

The idea was sparked by Associate Professor Lauren Gardner, a civil and systems engineering professor at JHU. Prior to joining JHU last year, Gardner was a senior lecturer in civil engineering at the University of New South Wales (UNSW) Sydney and an Engineers Without Borders Australia facilitator.

The Johns Hopkins COVID-19 Dashboard.

Together with first-year PhD student Ensheng Dong, Gardner developed the dashboard in January, initially tracking the virus’ spread in Wuhan, where Dong was concerned about friends and family living in the area. 

“We built this dashboard because we think it is important for the public to have an understanding of the outbreak situation as it unfolds with transparent data sources,” Gardner said in late January, when the site was first released to the public. 

“For the research community, this data will become more valuable as we continue to collect it over time.”

And she was right. Today, the site gets more than a billion requests a day from around the world.

Collecting the data

The Dashboard’s data sources include the WHO, the US Centers for Disease Control and Prevention, the European Centre for Disease Prevention and Control and the National Health Commission of the People’s Republic of China, in addition to local media reports and health departments. 

In the first few weeks, PhD student Dong was entering all of the data by himself, manually plugging in numbers. That quickly became a monumental task and now, nearly everything is entered automatically.

The team, which has grown from two members to a couple of dozen, has added features over time, including per capita rates of COVID-19 testing, hospitalisation and incidence, and case-fatality ratios. All data collected and displayed is made freely available, along with the Dashboard’s feature layers.

“We massively underestimated the general public’s interest. People are just really desperate for information that they trust.”
Lauren Gardner

As well as providing an overview of the global situation, the data is driving US state and federal government policy in regards to resource allocation. 

“We’re absolutely doing short-term forecasting looking at what are the next spatial hot spots,” Gardner said.

“[For example] where should we be allocating resources to better prepare for the next city or the next state that’s [going to] see a surge in cases?

“I think what we massively underestimated was the general public’s interest. It didn’t even cross our mind how popular the interface would be … People are just really desperate for information that they trust.”

Exit mobile version