CREATE
  • Technology
    • BIOTECH
    • COMMUNICATIONS
    • COMPUTING
    • IMAGING
    • MATERIALS
    • ROBOTICS
    • SOFTWARE
  • Industry
    • DEFENCE
    • INFRASTRUCTURE
    • INNOVATION
    • MANUFACTURING
    • POLICY
    • PROJECTS
    • TRANSPORT
  • Sustainability
    • ENERGY
    • ENVIRONMENT
    • RESOURCES
  • Community
    • CULTURE
    • PEOPLE
  • Career
    • EDUCATION
    • INSPIRATION
    • LEADERSHIP
    • TRENDS
  • About
    • CONTACT
    • SUBSCRIBE
No Result
View All Result
CREATE
No Result
View All Result
Home Industry Infrastructure

By the numbers: How does Australian investment in public infrastructure match up globally?

Petra Stock by Petra Stock
25 July 2024
in Infrastructure, Features
7 min read
1
By the numbers: How does Australian investment in public infrastructure match up globally?

Image credit: Getty Images

These eight graphs reveal a disparity in infrastructure funding between Australian states and territories, and that national investment as a percentage of GDP is high compared to other countries.

Australian states and territories plan to spend $256.6 billion on infrastructure over the next four years, according to a review of 2023-24 budgets and government expenditure by Infrastructure Partnerships Australia. 

In Victoria, infrastructure accounts for 20 per cent of government expenditure in the state, a higher share than other states and territories. New South Wales allocating $85.6 billion, or 16.6 per cent of the state’s budget. 

Michael Bell AffillEAust, Head of Policy at Engineers Australia, told create that investment in infrastructure is critical to support the economy and productivity.

“Infrastructure [is] vital to support sustainable and liveable communities, and is critical to every aspect of life.”
Michael Bell AffillEAust

“Infrastructure is the cornerstone of civilisation,” he said. “It’s vital to support sustainable and liveable communities, and is critical to every aspect of life.

“Everything you do, every day, has an aspect of engineering and infrastructure to it. If you’re driving to the shops, you’re on the roads. A phone call requires communications infrastructure. Underlying internet networks facilitate the Internet of Things (IoT) and smart technologies in many industries.”

These broad benefits are reflected in the strategic themes – productivity and resilience, liveability and sustainability – outlined in the Australian Government’s Infrastructure Policy Statement, Bell said.

Funding by state and territory

The graph below outlines infrastructure funding across Australia’s states and territories, and as a percentage share of total expenditure.

Made with Flourish

On average, state and territory governments allocated $9694 per person on infrastructure. Yet there is a wide disparity between the highest rates in the Northern Territory ($18,125 per capita) and Victoria ($11,600), and the lowest in Western Australia ($5500). See below for all jurisdictions:

Made with Flourish

In most states, transport and energy sectors dominate the infrastructure pipeline, according to data published by Infrastructure Partnerships Australia. 

However, Oxford Economics anticipates a shift in priorities in 2024, away from transport and towards utilities and social infrastructure.

Big spender

Australia’s infrastructure spending is relatively high as a percentage of national gross domestic product (GDP) compared to other countries.

The nation ranked 10th out of 49 countries according to data collated by World Population Review. China topped the list with infrastructure spending at 4.8 per cent of the country’s GDP.

China spent the most overall on transport infrastructure, investing the equivalent of $1127 billion AUD on roads, and $162 billion AUD on rail according to OECD data from 2022.

On roads, Australia ranks fourth in terms of spending, behind China, the United States and Germany.

Made with Flourish

Obviously, what this mostly reveals is China’s massive infrastructure spend – so let’s delve a little deeper and present that gross investment per capita.

Made with Flourish

In this view, it’s clear that Australia actually comes out on top in road spend per capita.

Meanwhile, when it comes to rail, Australia is fifth in line behind China, Japan, France and Germany.

Made with Flourish

Again, China dominates – so for a more nuanced cut of the data let’s take a look at what that investment looks like per capita.

Australia is in second place when it comes to rail infrastructure spend per capita, just ahead of Austria and more than four times that of China.

Made with Flourish

Bang for buck?

Grattan Institute has questioned whether Australian taxpayers are getting good value for government infrastructure spending. In its Megabang for Megabucks report, the policy thinktank argued infrastructure costs are higher in Australia compared to the global average. 

For example, data on rail construction costs per kilometre are higher in Australia than comparably wealthy countries such as Canada and Japan.

According to Grattan, contributing factors include insufficient competition, lack of transparency and lax procurement practices.

The graph below shows that rail projects cost more in Australia than in many other OECD countries.

Made with Flourish

Infrastructure and employment

Government spending on infrastructure has been shown to unlock economic benefits, including direct and indirect job creation.

International Monetary Fund research shows investing in energy creates more jobs per million than road infrastructure in advanced economies such as Australia. Meanwhile, in low income and emerging economies, water and sanitation delivered the highest rate of job creation.

In Australia, demand for infrastructure workers now exceeds supply.
According to Infrastructure Australia, the sector needs an additional 229,000 skilled workers – a shortfall 129 per cent larger than the current workforce – with particular shortages among engineers and scientists. Professions such as structural, civil and geotechnical engineers and land surveyors are in short supply.

“Broadly speaking, we don't have the pipeline of engineers that is needed to achieve our goals.”
Michael Bell AffillEAust

Bell agreed the engineering profession faces skills challenges in Australia.

“Broadly speaking, we don’t have the pipeline of engineers that is needed to achieve our goals,” he said.

The problem is exacerbated by overseas-born engineers living in Australia who can’t find employment commensurate with their skills and experience.

Engineers Australia continues to advocate for actions to address the shortage.

“That’s across all aspects of the pipeline,” Bell continued. “Starting at school, encouraging more students in school to get involved in maths and science, showing the benefits of STEM, and then supporting students at university and those coming out of university.”

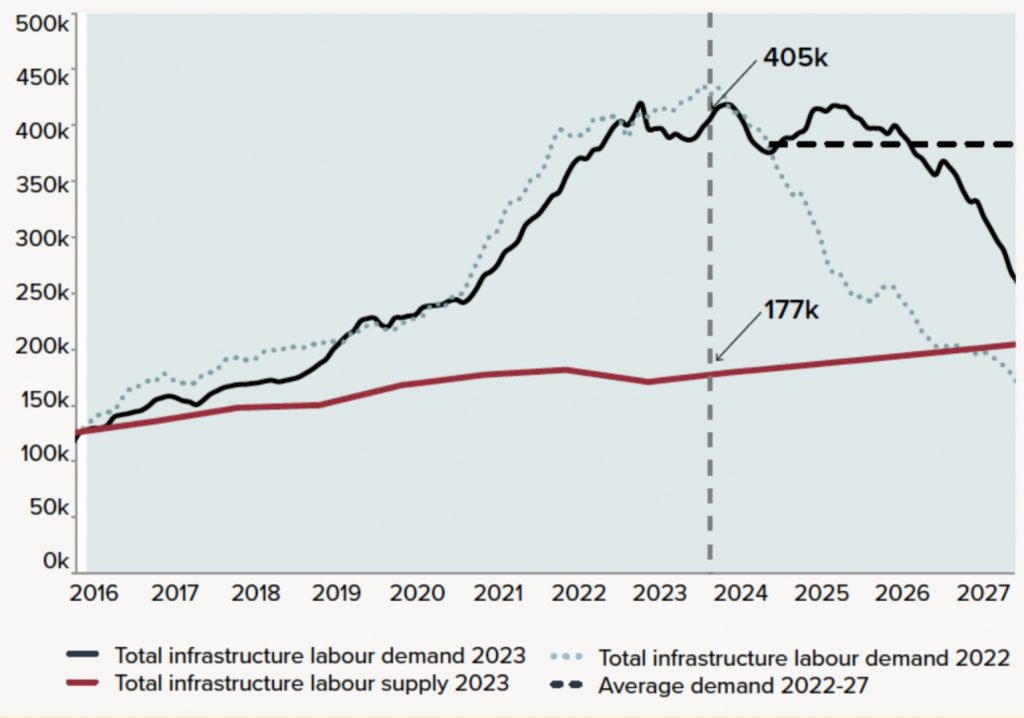
The below graph depicts the demand and supply of infrastructure workers over time.

Source: Infrastructure Australia (2023) Market Capacity Report (CC BY 3.0)

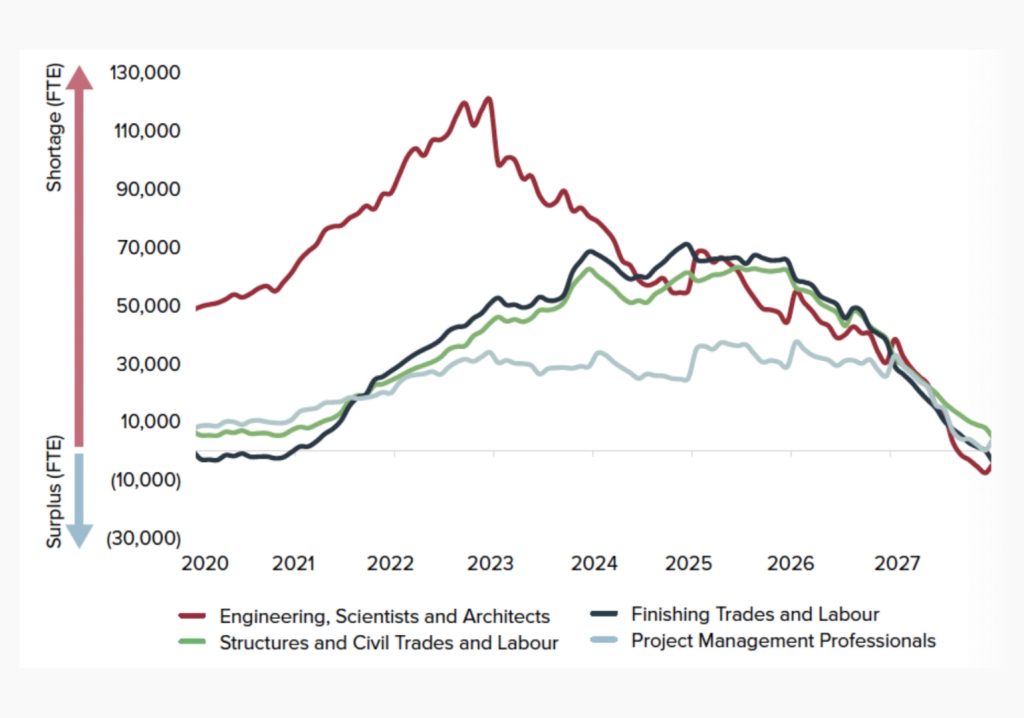
And here is the projected shortage in the public infrastructure workforce by occupation group up until 2027.

Source: Infrastructure Australia (2023) Market Capacity Report (CC BY 3.0)

Public attitudes to infrastructure

A global Ipsos survey of 22,816 participants across 31 countries in 2023 found a majority in most countries agreed infrastructure plays a role in creating new jobs and growing the economy.

A majority in most countries wanted more done to meet infrastructure needs, including 58 per cent in Australia.

Made with Flourish

The majority (72 per cent) of Australians rate the quality of airports as very, or fairly good, major roads (58 per cent) and rail (56 per cent). In comparison, only a minority (27 per cent) of Australians thought the quality of new housing supply was good/ very good.

The survey found four in ten Australians satisfied with their national infrastructure, a satisfaction rate that was lower than places such as Singapore (74 per cent) and Indonesia (66 per cent but higher than New Zealand (29 per cent) and Italy (22 per cent).

Tags: capital expenditureeconomy
Previous Post

Why integrating systems is essential for zero-carbon mining

Next Post

From satellites to submarines: taking the world’s strongest stainless steel bolts to extremes

Petra Stock

Petra Stock

Next Post
From satellites to submarines: taking the world’s strongest stainless steel bolts to extremes

From satellites to submarines: taking the world’s strongest stainless steel bolts to extremes

Comments 1

  1. Stephen Buttling says:
    10 months ago

    In my opinion, this is hardly surprising, when you consider the size of the country and the population. The Global average population density, excluding Antarctica, is 54 people per square km. In many small countries, like the UK, it is much higher at 277 per square km. In China it is 149, in USA 35, and in Australia 3! Surely if you consider yourself a developed nation, but your people are scattered thinly over a wide area, then you will need more infrastructure. That should be obvious, even to the Grattan Institute.

    Reply

Leave a Reply Cancel reply

Your email address will not be published. Required fields are marked *

    WANT CREATE DELIVERED DIRECT TO YOUR INBOX? SUBSCRIBE TO OUR NEWSLETTER.

    By subscribing to create you are also subscribing to Engineers Australia content. Please find our Terms and conditions here

    create is brought to you by Engineers Australia, Australia's national body for engineers and the voice of more than 120,000 members. Backing today's problem-solvers so they can shape a better tomorrow.
    • ABOUT US
    • CONTACT US
    • SITEMAP
    • PRIVACY POLICY
    • TERMS
    • SUBSCRIBE

    © 2024 Engineers Australia

    No Result
    View All Result
    • Technology
      • BIOTECH
      • COMMUNICATIONS
      • COMPUTING
      • IMAGING
      • MATERIALS
      • ROBOTICS
      • SOFTWARE
    • Industry
      • DEFENCE
      • INFRASTRUCTURE
      • INNOVATION
      • MANUFACTURING
      • POLICY
      • PROJECTS
      • TRANSPORT
    • Sustainability
      • ENERGY
      • ENVIRONMENT
      • RESOURCES
    • Community
      • CULTURE
      • PEOPLE
    • Career
      • EDUCATION
      • INSPIRATION
      • LEADERSHIP
      • TRENDS
    • About
      • CONTACT
      • SUBSCRIBE
    preload imagepreload image