CREATE
  • Technology
    • BIOTECH
    • COMMUNICATIONS
    • COMPUTING
    • IMAGING
    • MATERIALS
    • ROBOTICS
    • SOFTWARE
  • Industry
    • DEFENCE
    • INFRASTRUCTURE
    • INNOVATION
    • MANUFACTURING
    • POLICY
    • PROJECTS
    • TRANSPORT
  • Sustainability
    • ENERGY
    • ENVIRONMENT
    • RESOURCES
  • Community
    • CULTURE
    • PEOPLE
  • Career
    • EDUCATION
    • INSPIRATION
    • LEADERSHIP
    • TRENDS
  • About
    • CONTACT
    • SUBSCRIBE
No Result
View All Result
CREATE
No Result
View All Result
Home Sustainability Environment

Explainer: Five graphs that illustrate the extent of ocean plastic pollution

Lachlan Haycock by Lachlan Haycock
20 June 2024
in Environment, Features
4 min read
0
Explainer: Five graphs that illustrate the extent of ocean plastic pollution

Europe is the biggest exporter – and importer – of plastic waste. Image credit: Getty Images

Which countries are the biggest contributors to global ocean plastic pollution, and which parts of the world export and import the most plastic waste?

Key points:

  • Around 0.5 per cent, or up to two million t, of all plastic waste ends up in the ocean, according to the OECD.
  • Countries such as Suriname and Saint Lucia are among the highest emitters of plastic waste relative to GDP per capita.
  • Europe is both the biggest exporter and the biggest importer of plastic waste.

Plastic pollution is not a problem easily solved, but realising the true scope of the issue is a good start.

Around 0.5 per cent of all plastic waste enters the ocean. This may not seem like much, but when the total amount of plastic generated each year totals approximately 350 million t, that means anywhere between one and two million t of plastic ends up polluting the world’s oceans, according to the OECD.

These five graphs explore: the share of total waste emitted by different countries; why smaller rivers play a larger role than initially thought; and why most plastic waste exports are sent to countries in the same region rather than further afield.

Top emitters

Countries in Asia contribute the largest proportion, or 80.99 per cent, of plastic waste to the world’s oceans.

At the top of the list is the Philippines (36.38 per cent share), followed by India (12.92 per cent), Malaysia (7.46 per cent), China (7.22 per cent) and Indonesia (5.75 per cent).

Towards the other end of the spectrum, Australia’s share is less than 0.01 per cent, comparable to New Zealand; Nordic countries such as Norway and Sweden; and Kazakhstan.

Previous studies, such as those conducted by Schmidt et al. and Lebreton et al. in 2017, suggested that the top 10 waste-emitting rivers contribute a larger proportion than is likely the case.

Of those 10 rivers, seven are in the Philippines:

  1. Pasig (Philippines)
  2. Klang (Malaysia)
  3. Ulhas (India)
  4. Tullahan (Philippines)
  5. Meycauayan (Philippines)
  6. Pampanga (Philippines)
  7. Libmanan (Philippines)
  8. Ganges (India)
  9. Rio Grande de Mindanao (Philippines)
  10. Agno (Philippines)

Whereas it had been thought that these rivers contributed between 56 and 91 per cent of plastic waste sent into oceans, that figure may be closer to just 18 per cent according to the results of a more rigorous and recent study in 2021.

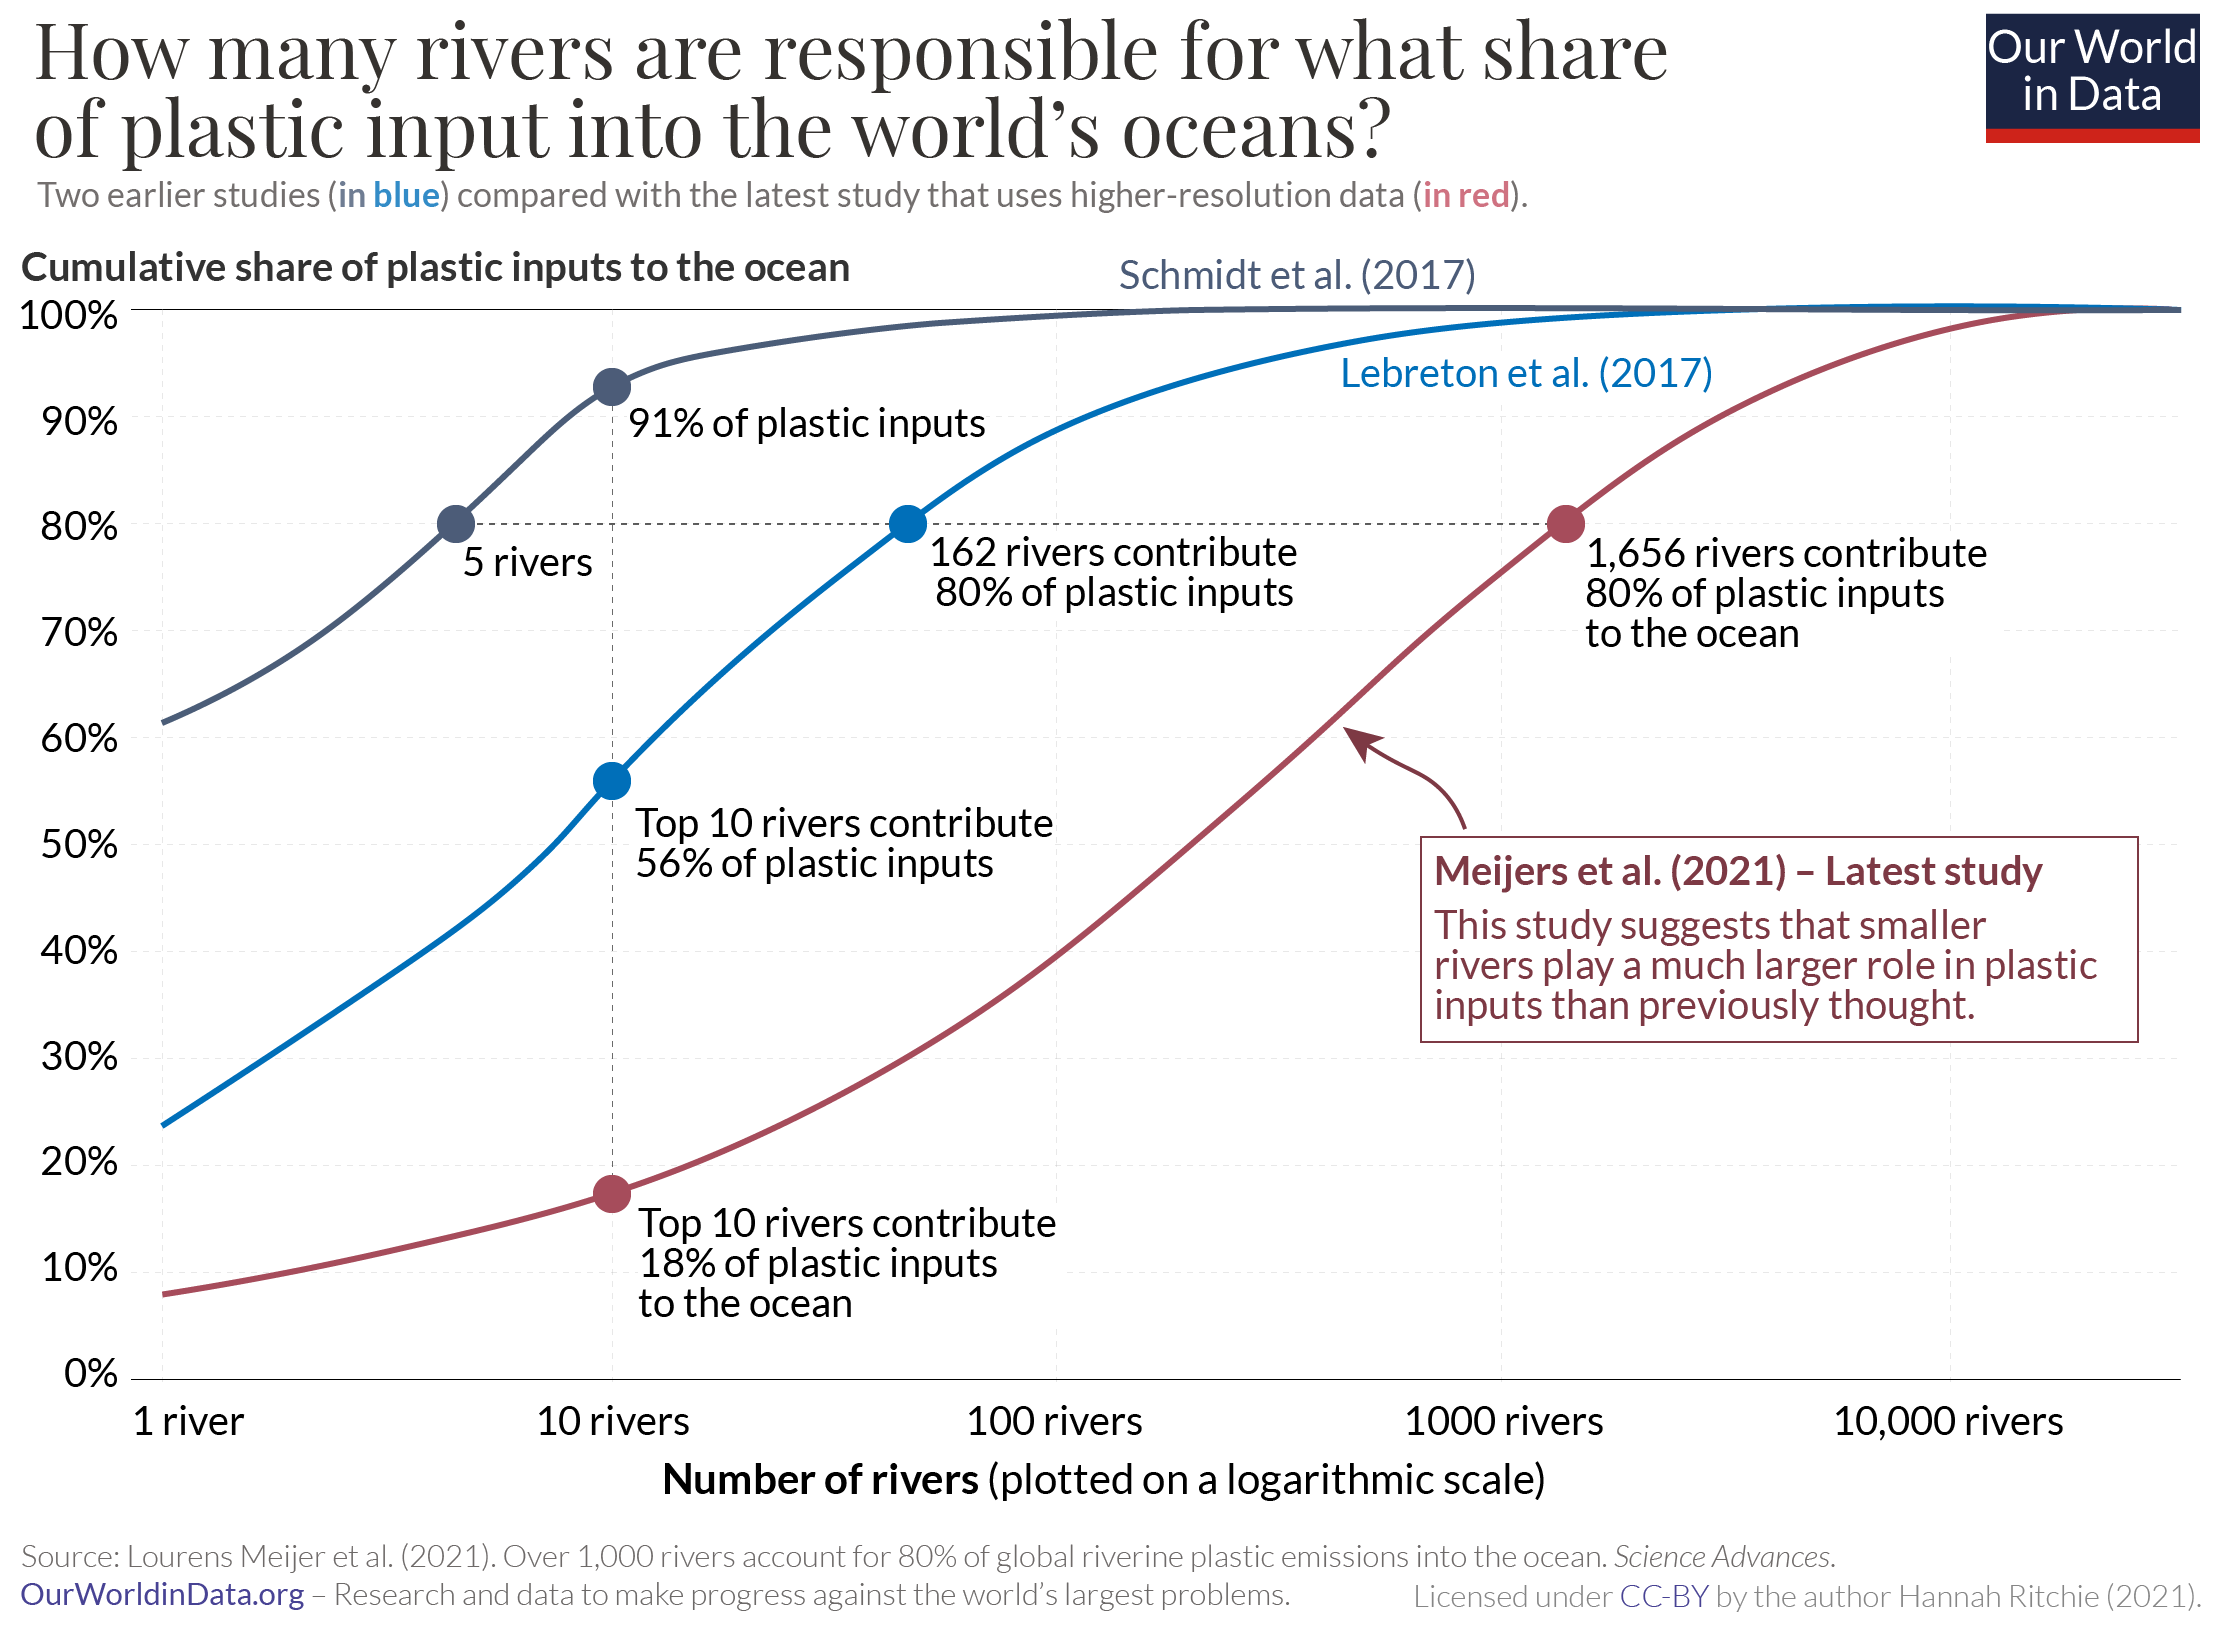
Rather than diminishing the role played by those 10 rivers, these findings broaden the scope of the issue; more than 1600 rivers are estimated to produce 80 per cent of the global plastic input to oceans.

The intersection between waste and GDP is also worth exploring.

From the graph below, it can be seen that countries such as Suriname, Trinidad and Tobago, and Saint Lucia are also high emitters of plastic waste to the ocean relative to GDP per capita.

Imports and exports

The graph below shows that the rate of plastic waste being traded has dropped by two-thirds since 2010.

China used to be the world’s largest importer, taking more than half of the world’s traded plastic waste in 2016. Just two years later, that figure had dropped to below one per cent.

The majority of plastic waste exported from countries in Europe are sent to neighbouring countries rather than other continents; 2.8 million t remains within Europe’s borders, while 0.6 million t goes to Turkey.

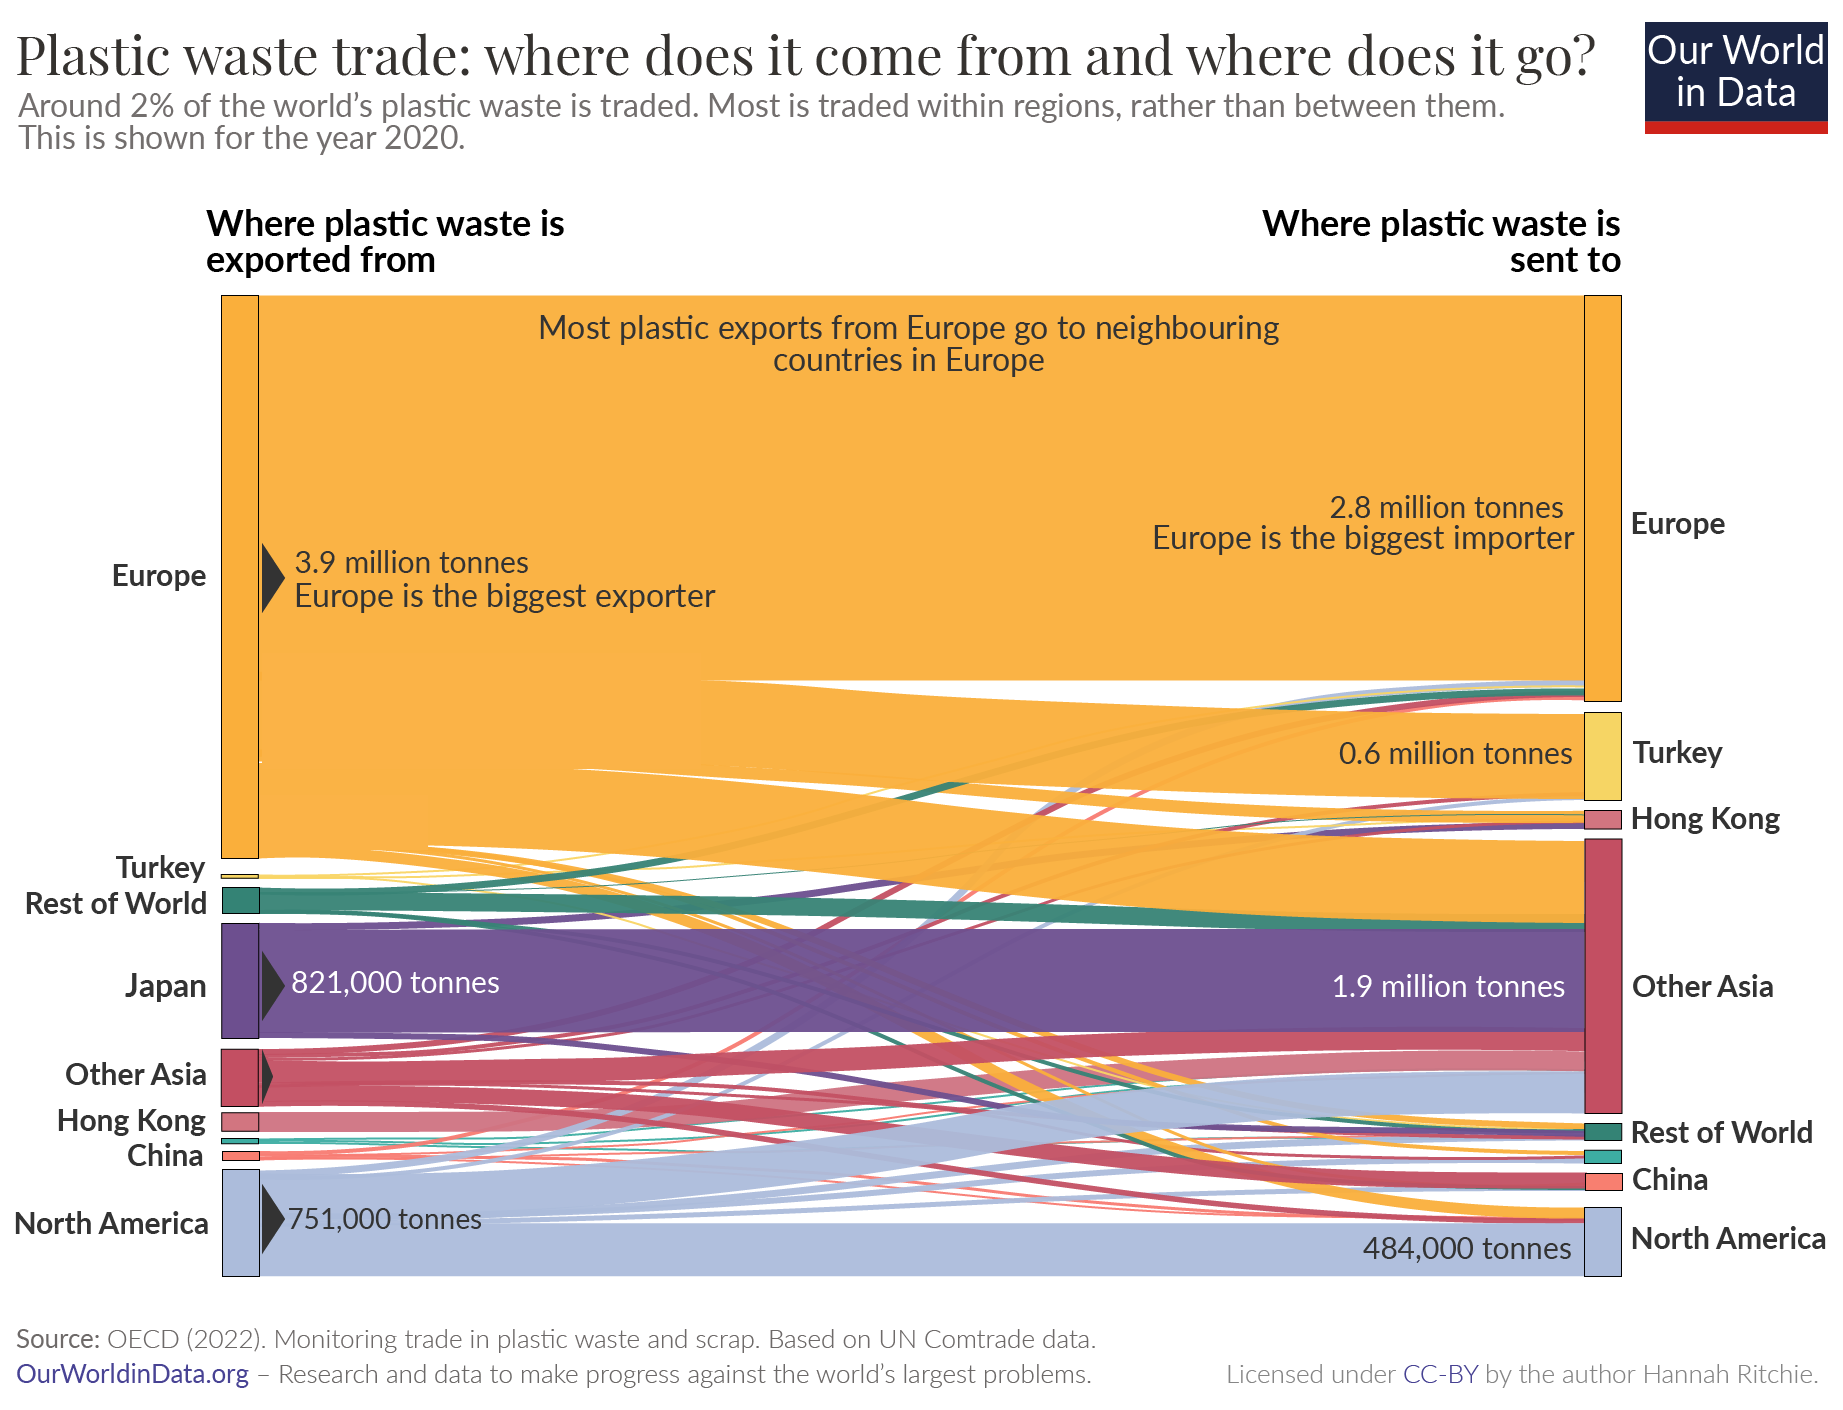
Japan, Asia’s largest exporter, sends most of its 821,000 t of waste to other countries in Asia, while more than half of North America’s waste is sent elsewhere in North America.

The issue of plastic waste in the world’s oceans and across borders, it seems, is a cyclical one.

For more from create digital, check out the below:

  • The future of methane in four graphs
  • These three companies are minimising the impact of ocean plastic pollution.
  • AI gives rise to Australian-made spore-trapping technology.
Tags: plastic wastemicroplastics
Previous Post

Techwatch: Four of the latest developments in engineering and technology

Next Post

Are ideas about floating and flood-resilient housing beginning to sink in?

Lachlan Haycock

Lachlan Haycock

Lachlan Haycock is a journalist and translator who has written for publications in Australia and abroad. His passion for all things Indonesian is second only to the accurate use of apostrophes on public signage.

Next Post
Are ideas about floating and flood-resilient housing beginning to sink in?

Are ideas about floating and flood-resilient housing beginning to sink in?

Leave a Reply Cancel reply

Your email address will not be published. Required fields are marked *

    WANT CREATE DELIVERED DIRECT TO YOUR INBOX? SUBSCRIBE TO OUR NEWSLETTER.

    By subscribing to create you are also subscribing to Engineers Australia content. Please find our Terms and conditions here

    create is brought to you by Engineers Australia, Australia's national body for engineers and the voice of more than 120,000 members. Backing today's problem-solvers so they can shape a better tomorrow.
    • ABOUT US
    • CONTACT US
    • SITEMAP
    • PRIVACY POLICY
    • TERMS
    • SUBSCRIBE

    © 2024 Engineers Australia

    No Result
    View All Result
    • Technology
      • BIOTECH
      • COMMUNICATIONS
      • COMPUTING
      • IMAGING
      • MATERIALS
      • ROBOTICS
      • SOFTWARE
    • Industry
      • DEFENCE
      • INFRASTRUCTURE
      • INNOVATION
      • MANUFACTURING
      • POLICY
      • PROJECTS
      • TRANSPORT
    • Sustainability
      • ENERGY
      • ENVIRONMENT
      • RESOURCES
    • Community
      • CULTURE
      • PEOPLE
    • Career
      • EDUCATION
      • INSPIRATION
      • LEADERSHIP
      • TRENDS
    • About
      • CONTACT
      • SUBSCRIBE
    preload imagepreload image