
Australia’s data centre boom will reshape electricity and water demand. Long before the servers arrive, engineers must model a facility whose size, workload and technology may all change.
A data centre proposed today could still be operating in the 2040s, while the servers inside it may be replaced several times. Its tenants may run cloud storage, general computing or intensive AI workloads, and the rate at which its data halls fill may be uncertain. Yet electricity networks, water utilities and planning authorities need numbers now.
The scale is becoming hard to ignore. The Australian Energy Market Operator’s (AEMO) 2026 Electricity Statement of Opportunities estimates that data centres consumed around 5 TWh of electricity in 2025–26, representing 2.8 per cent of operational consumption across the National Electricity Market (NEM).
Under its Step Change scenario, which models a relatively rapid transformation of Australia’s energy system, AEMO forecasts consumption will triple to about 15 TWh, or 7.8 per cent of NEM operational consumption, by 2029–30. By 2035–36, it could reach 34 TWh, or 13 per cent.
Behind those forecasts sit practical decisions: how large a grid connection to provide, whether cooling should use air or water, how much equipment to install initially and what must be available during a heatwave.
“Almost every design input is variable and depends on how the data centre will be used,” said Dr Amr Omar, a Senior Research Associate in UNSW’s School of Mechanical Engineering who models data centre water and energy demand across Australian climate zones.
“The building may operate for 20 years or more, while the servers inside it are typically replaced every three to five years. Electricity and water consumption should therefore be reported as a range, supported by clear assumptions, rather than as a single number.”
READ: Data centres in the age of AI
Following the energy
The starting point is the IT load: the electricity consumed by servers, storage and networking equipment. Almost all of it eventually becomes heat, which must be removed while the equipment runs around the clock.
“IT load is the most important parameter, with almost everything else acting as a multiplier,” Omar said.
Engineers build scenarios for the number and density of server racks, the computing they will perform and how quickly the facility will approach capacity. They then add the electricity required by cooling, pumps, power conversion and other supporting systems.
Rack density can change the physical design. Omar said removing heat with air generally becomes difficult above about 15-20 kW per rack. Higher-density equipment may need liquid delivered closer to the heat source, including direct-to-chip cooling.
Actual load matters as much as maximum capacity. A new facility might initially operate at only 30 per cent of its design load. Systems sized for the theoretical peak can run inefficiently for years as the data halls fill.
Jeff Van Zetten, Chief Engineering & Design Officer at NEXTDC, has overseen the company’s data centre design since it was founded in 2010. He is also completing a PhD based on data centre energy efficiency.
“Modelling is key to informing our key design decisions, costs, energy and outcomes,” he said.
NEXTDC cross-checks results from separate internal teams and consultants, using energy-modelling software and calculations based on engineering fundamentals. Van Zetten said three independent points of reference should ideally produce similar results, with any differences investigated and explained.
READ: Is it possible to manufacture data centres in space?
The water and power trade-off
Cooling introduces another choice. Evaporating water removes heat efficiently, reducing the electricity required by chillers. Dry cooling can bring on-site water consumption close to zero, but generally requires more electricity to reject the same heat, particularly on hot afternoons when the grid may already be strained.
Climate changes the calculation. A system in dry Perth will behave differently from one in humid Darwin, while cooler cities may offer more hours with less need for mechanical cooling. Omar said engineers should use hourly weather data and test designs under extreme conditions.
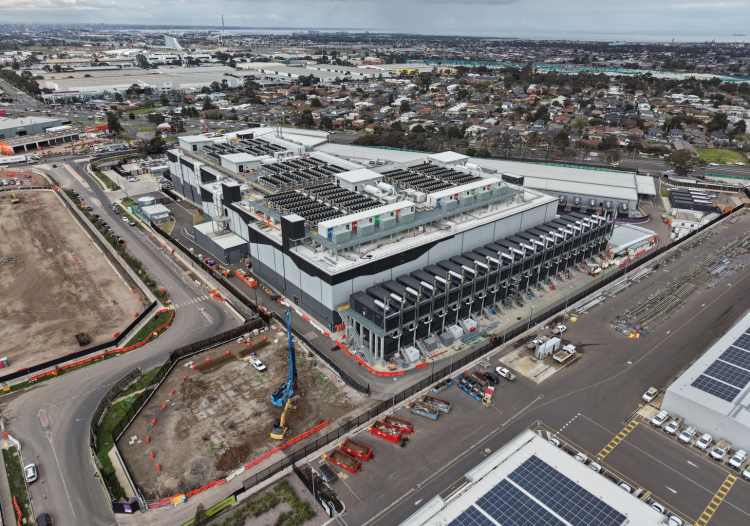
At NEXTDC’s planned S4 data centre in Sydney, designed for 350 MW of IT capacity, modelling supported the business case for using recycled wastewater in the cooling system. Van Zetten said the approach could improve efficiency, reduce equipment requirements and lower capital and lifetime costs, while avoiding drinking water use and reducing treated wastewater discharge.

Two common measures help compare designs. Power usage effectiveness (PUE) divides total facility energy by the energy used by IT equipment. Water usage effectiveness (WUE) records on-site water consumption relative to IT energy use.
Both have limits. A low PUE does not reveal the absolute demand of a large facility. WUE excludes water used to generate electricity and does not distinguish between drinking and recycled water. Annual averages can also conceal the extreme days that determine network and plant capacity.
The result still depends on the inputs and how thoroughly the model is checked.
“Modelling is very complex with thousands of variables, and a single incorrect input variable creates drastically erroneous results,” Van Zetten said. “Models must be validated, ideally with actual site test measurement results.”
Done well, modelling helps engineers plan for changing technology and demand. It also gives electricity and water providers a clearer picture of what a data centre could require, long before its servers are switched on.
WEBINAR: Smart grounding for data centres and power network safety